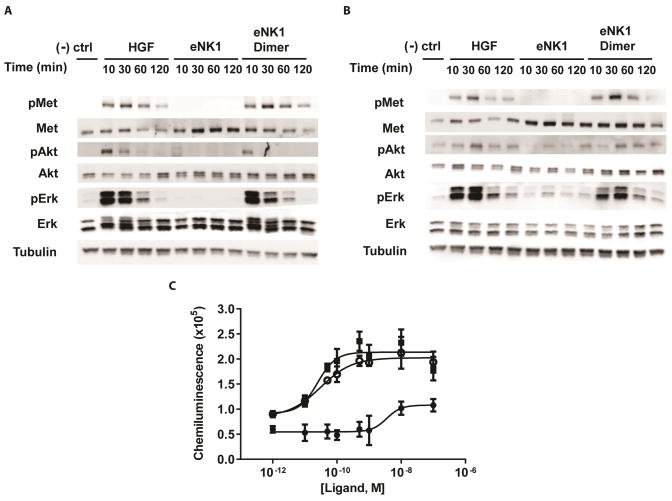
Figure 2. Phosphorylation of c-MET and downstream targets.
HGF, eNK1 monomer, or eNK1 dimer was added to HUVEC cells at concentrations of A) 1 nM, or B) 10 pM for the indicated timepoints. Negative control indicates basal media alone without added c-MET agonist. Western blots of cell lysates analyzed using a phospho-specific antibody (‘p’) indicate activated c-MET, Akt and Erk. Total protein levels of c-MET, Akt and Erk are shown to relate the fraction of phosphorylated protein to total protein between treatment conditions. Tubulin is shown as a control to indicate total protein loaded per gel lane prior to Western blotting. C) HGF, eNK1 monomer, or eNK1 dimer were added to c-MET expressing cells, and activation was quantified using the DiscoveRx PathHunter system, which measures chemiluminescence as a readout. HGF is depicted as filled squares, eNK1 monomer as filled circles and eNK1 dimer by open circles.

