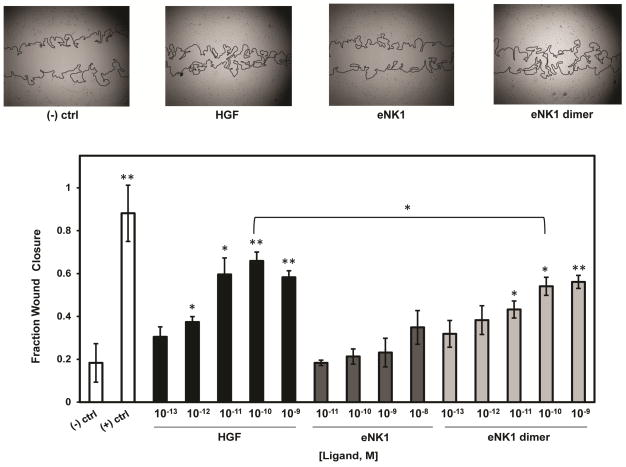
Figure 3. Cell migration assay.
Top images show representative HUVEC wounds 24 h following incubation with 10 pM FGFb and 1 nM HGF, eNK1 monomer, or eNK1 dimer. Bar graph shows the fraction of wound closure with increasing concentrations of HGF or NK1 variant. Negative control represents media containing 10 pM FGFb alone. Positive control represents incubation of cells in complete growth media. Significance was measured against the negative control except where indicated. *p<0.05, **p<0.005. p<0.005 for all corresponding concentrations between HGF/eNK1 dimer and eNK1 monomer.

