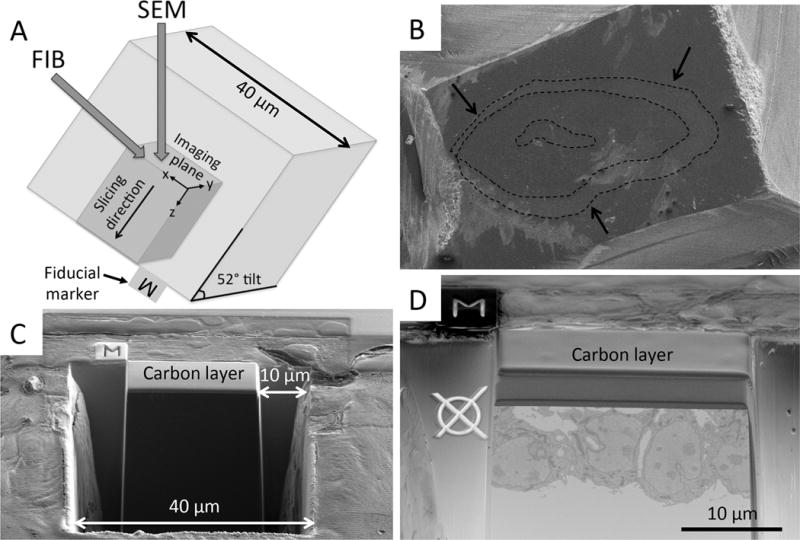
Figure 1. Preparation steps for FIB-SEM imaging.

(A) Schematic of FIB-SEM configuration demonstrates the angle of the FIB and SEM beams relative to the imaging plane. (B) Image obtained using a relatively high acceleration voltage, so that the OFT tissue could be located within the resin. From this image, the user selects a region of interest for FIB-SEM imaging. Dotted lines outline the OFT tissue layers (endocardium, cardiac jelly and myocardium), and the arrows denote the outer myocardial wall. (C) Carbon layer deposition and trenches. A thin layer of carbon is deposited with the FIB over the region of interest. Using the FIB, trenches are dug tangential to the imaging plane (40 μm width) and on either side of the region of interest (10 μm). (D) Fiducial markers. Imaging fiducial marker (Ø) is milled into the resin and the milling fiducial (M) onto a platinum coated area close to the carbon protected area. Both fiducials enable automatic image detection and alignment correction in both the imaging and milling positions between each slice and view pass. To acquire the image in panel D the stage was tilted such that the angle between the block face imaging plane and the SEM beam was 45 degrees, the angle for optimal viewing of the block face.
