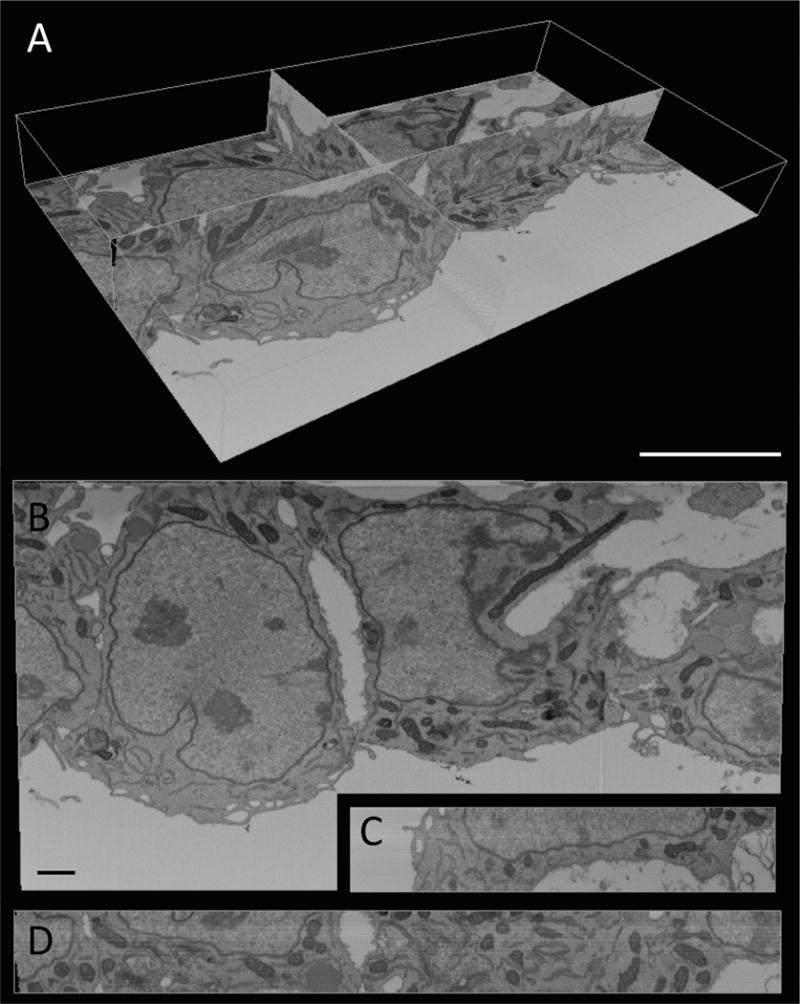
Figure 2. 3D view and orthoslices from FIB-SEM imaging of the endocardium.

(A) Volumetric view of acquired images. Three imaging planes are shown to illustrate the 3D nature of FIB-SEM data. A bounding box (white) outlines the total volume of this dataset. Scale, 5 μm. (B-D) Orthoslices from each of the imaging planes shown in A: (B) X-Y plane; (C) X-Z plane; (D) Y-Z plane. Scale, 1μm. The X-Y plane (B) shows the view of sections as they come off the block face, while the X-Z plane (C) and Y-Z plane (D) demonstrate the depth of sectioning performed during this example scan (400 slices in the Z direction, with 4 nm distance between contiguous slices). A video panning through this entire image stack can be found online (http://www.ohsu.edu/xd/education/schools/school-of-medicine/departments/basic-science-departments/biomedical-engineering/research/examples-of-fib-sem-images.cfm).
