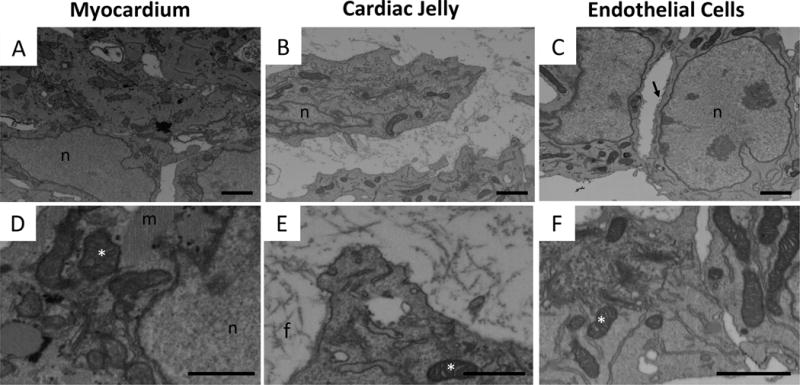
Figure 4. FIB-SEM imaging of the three layers of the cardiac outflow tract wall.

FIB-SEM images of representative regions of the OFT wall layers: (A, D) myocardium, (B, E) cardiac jelly, and (C, F) endocardium. Top row (A–C), depicting regions of ~5.5 μm × 8 μm, demonstrate general tissue contrast and highlight prominent differences in cellular organization and cellular versus extracellular composition of the three layers. Bottom row (D–F), showing higher magnification views, highlights organelle contrast and tissue ultrastructure. n, nucleus; m, myofibrils; f, fibers in extracellular matrix; *, mitochondria; arrow, microvilli.
