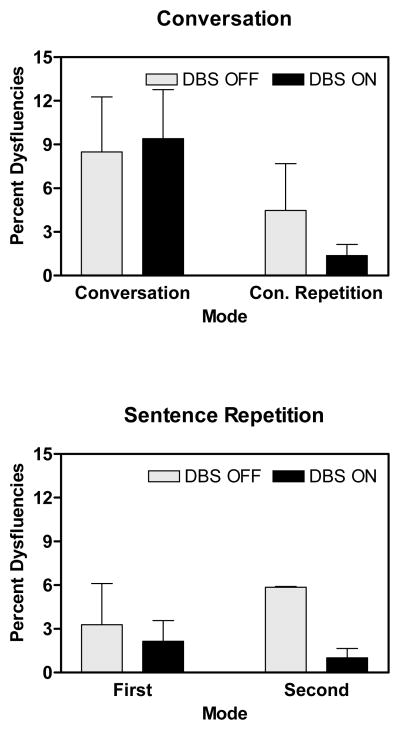
Figure 2.
Mean number of dysfluencies measured in speech produced during spontaneous conversation and the repetition of utterances produced during conversation (conversation-repetition) and the first and second repetitions. Both tasks were performed in the DBS-OFF and DBS-ON states. The number of dysfluencies represents the difference between the number of target syllables in the utterance and the actual number of syllables produced. This number is then expressed as a percentage of the total syllables produced. Higher values represent greater percentages of dysfluencies.

