
Figure 5.
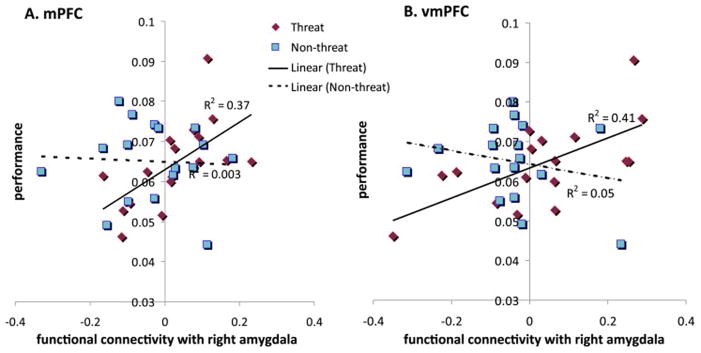
Correlations of functional connectivity and performance by condition. Individual differences analyses were conducted to investigate associations of functional connectivity strength and performance separately in the threat and nonthreat conditions. Scatter plots show the relationship between performance, measured as the average rate of prey captures (y-axis), with functional connectivity, quantified as the average right amygdala psychophysiological interaction beta coefficient (x-axis), for the medial prefrontal cortex (mPFC) and ventromedial prefrontal cortex (vmPFC) assessed during threat (red diamonds) and nonthreat (blue squares). (A) The correlation in the mFC for the threat condition (R2 = .37) was stronger than the correlation for the nonthreat condition (R2 = .003), based on the modified Pearson-Filon (ZPF) statistic = 2.11, p = .035. (B) The correlation in the vmFC for the threat condition (R2 = .41) was stronger than the correlation for the nonthreat condition (R2 = .05), based on the modified Pearson-Filon (ZPF) statistic = 2.82, p = .005.