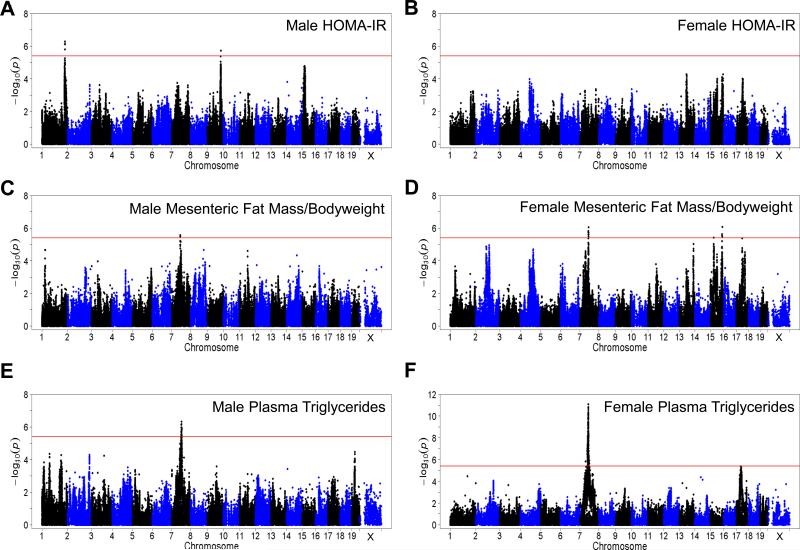
Figure 3. Widespread genetic control of IR and related traits.
(A-B) Manhattan plot showing the significance (–log10 of p) of all SNPs and HOMA-IR after 8 weeks of HF/HS feeding in male mice (A) and female mice (B).
(C-D) Manhattan plot showing the significance (–log10 of p) of all SNPs and mesenteric fat mass normalized to bodyweight after 8 weeks of HF/HS feeding in male mice (C) and female mice (D).
(E-F) Manhattan plot showing the significance (–log10 of p) of all SNPs and plasma triglyceride levels after 8 weeks of HF/HS feeding in male mice (E) and female mice (F).

