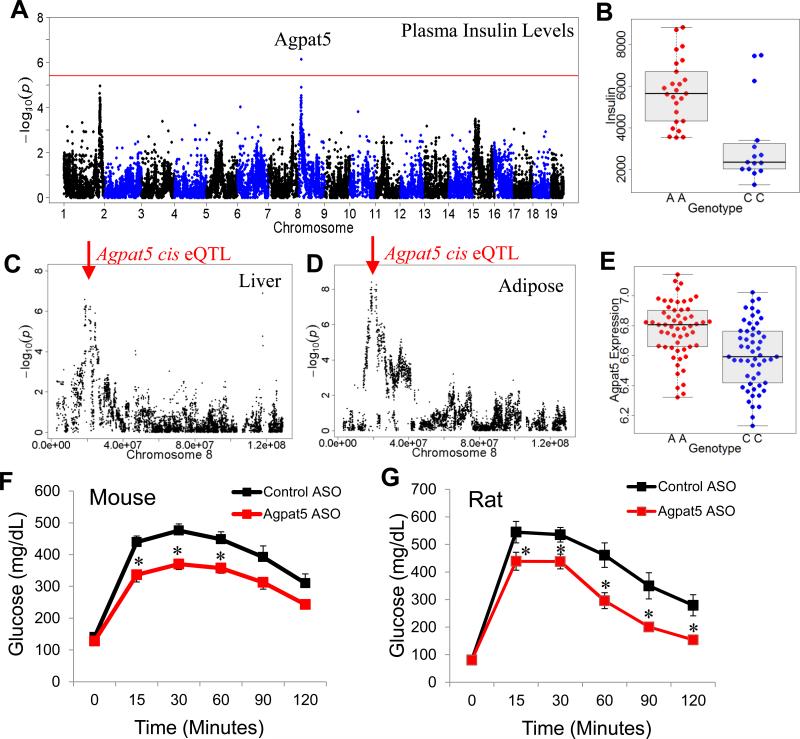
Figure 6. Identification and validation of Agpat5.
(A) Manhattan plot showing the significance (–log10 of p) of all SNPs and plasma insulin levels after 8 weeks of HF/HS feeding in male BXD RI strains. Candidate gene for genome-wide significant loci are indicated above genome-wide significant loci
(B) Plasma insulin levels based on genotype distribution at peak SNP associated with plasma insulin levels on chromosome 9 (rs36804270). Box and whisker plot depicting mean and distribution.
(C) Liver expression QTL (eQTL) for Agpat5 showing (–log10 of p) of all SNPs on chromosome 8 with indicated position of gene (red arrow) reflective of cis eQTL.
(D) Gonadal adipose expression QTL (eQTL) for Agpat5 showing (–log10 of p) of all SNPs on chromosome 8 with indicated position of gene (red arrow) reflective of cis eQTL.
(E) Agpat5 adipose expression based on genotype distribution at peak SNP associated with plasma insulin levels on chromosome 9 (rs36804270). Box and whisker plot depicting mean and distribution.
(F) IP-GTT in C57BL/6J mice fed a high-fat diet for 12 weeks and treated with control ASO or Agpat5 ASO for 8 weeks.
(G) IP-GTT in rats fed a high-fructose diet for 12 weeks and treated with control ASO or Agpat5 ASO for 8 weeks. Asterisk (*) indicates significance of p < 0.05. Error bars represent SEM.

