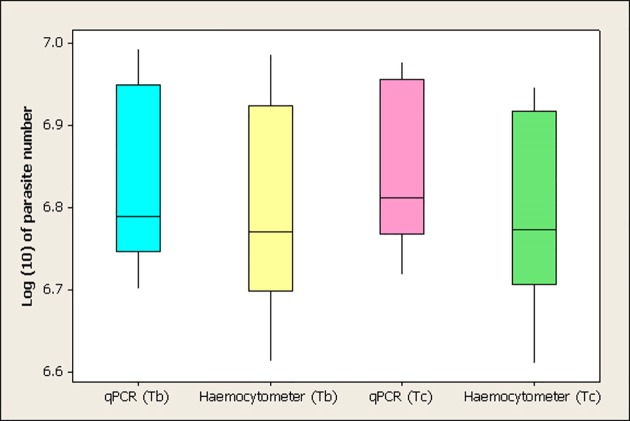
Fig 3. Boxplot showing the median log (10) number of parasites (Tb: T. b. brucei, Tc: T. congolense savannah) quantified using qPCR and haemocytometer in the single infected groups (Tb by qPCR: 6.79, Tb by Haemocytometer: 6.77, Tc by qPCR: 6.81, Tc by Haemocytometer: 6.77).
Numbers are presented on the log 10 scale, each boxplot shows the median value and the upper and lower quartiles.

