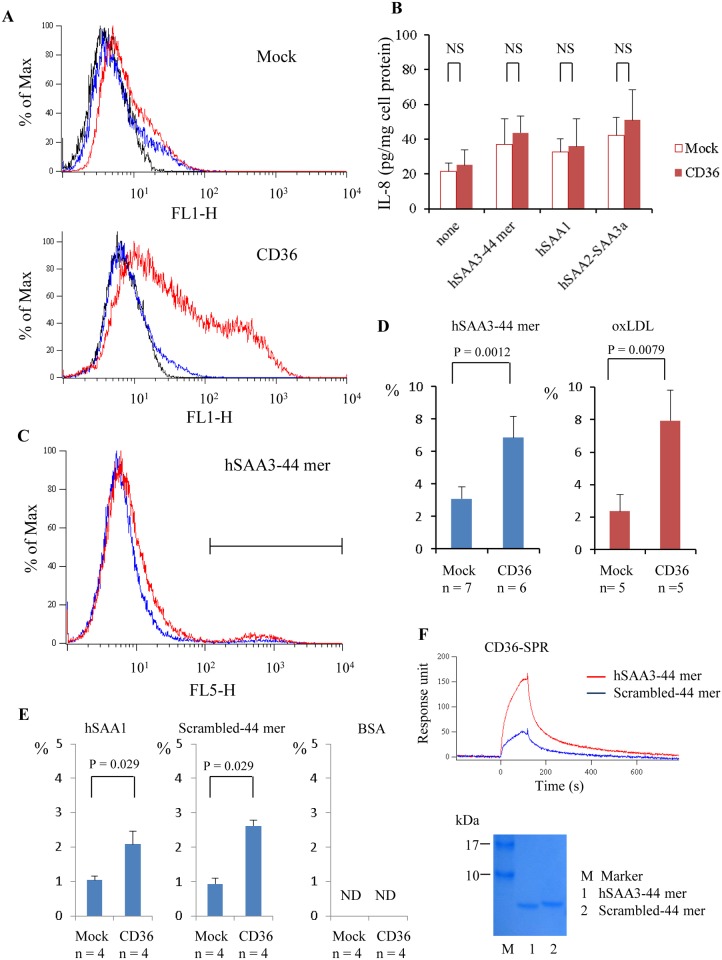
Fig 5. Interactions between hSAA3 C-terminal peptide and CD36.
(A) Blank vector (top panel) or CD36 expression vector (bottom panel) transfected HEK293T cells were subjected to flow cytometry analysis. Solid, blue, and red lines represent histograms for no 1st antibody, isotype control, and anti-CD36, respectively. (B) IL-8 levels in the culture supernatants. Blank vector or CD36 expression vector transfected HEK293T cells were incubated with hSAA1 (2 μg/ml), hSAA3 C-terminal 44 mer peptide (5 μg/ml), or hSAA2-SAA3a with DYKDDDDK tag (1 μg/ml) for 20 h in 0.2% BSA-DMEM. NS = not significant (P > 0.05). (C) HeLa cells were incubated with fluor-labeled hSAA3 C-terminal 44 mer (2 μg/ml) for 2 h in 0.2% BSA-DMEM. The cells were analyzed by a flow cytometer to estimate the ligand uptake. Blue and red lines represent histograms for mock and CD36 over-expressing HeLa cells, respectively (four independent experiments). (D) The ratios of the ligand uptake (fluor-labeled hSAA3–44 mer (2 μg/ml) or DiI-oxLDL (4 μg/ml)) indicated in the plot. (E) The rations of the fluor-labeled ligand (left) hSAA1 (2 μg/ml), (center) scrambled-44 mer peptide (2 μg/ml), and (right) BSA (2 μg/ml) are shown. ND = not detected. (F) Binding of hSAA3–44 mer peptide or scrambled-44 mer peptide on CD36 was analyzed by surface plasmon resonance. The peptide (10 μM, = 50 μg/ml) was applied (0–120 sec) on a sensor chip coated with recombinant CD36. Sensorgrams show association (0–120 sec) and dissociation (120–780 sec) of analytes (four independent experiments). The hSAA3–44 mer and scrambled-44 mer peptide were analyzed by SDS-PAGE. Analytes (100 ng each) were electrophoresed on a 15–20% gradient gel and stained with CBB.

