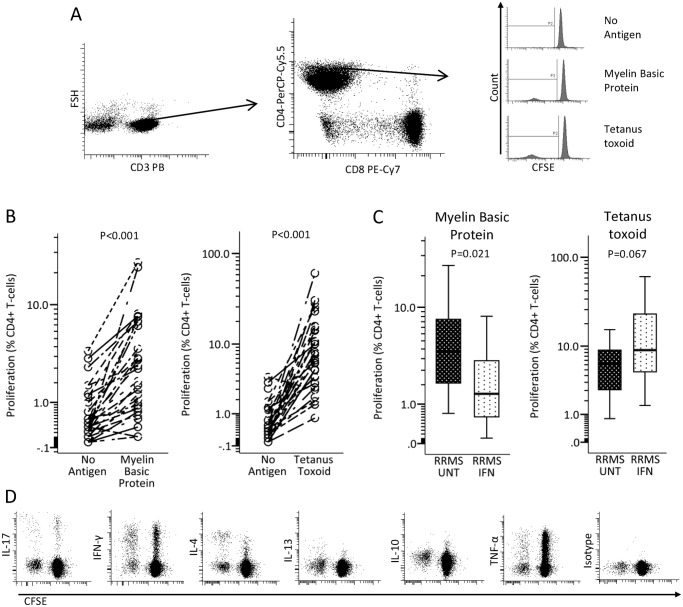
Fig 1. Responsiveness of CD4+ T-cells to myelin basic protein (MBP) and tetanus toxoid (TT) ex vivo.
(A) Representative dot plots and histograms showing the gating strategy for measurement of CD4+ T-cell proliferation—before T-cells were identified debris, dead cells and CD19+ cells had been excluded. (B) Graphs shows significant proliferative response of CD4+ T-cell to TT (n = 30; pooled data from 12 untreated and 18 interferon (IFN)-β treated relapsing remitting multiple sclerosis (RRMS) patients from the sub-study 2 population) and MBP (n = 31;pooled data from 13 untreated and 18 IFN-β treated RRMS patients from the sub-study 2 population). (C) Boxplots compare proliferative CD4+ T-cell responses to MBP in 13 untreated and 18 IFN-β treated patients and to TT in 12 untreated and 18 IFN-β-treated MS patients (sub-study 2 population). Boxes represent interquartile range, median value indicated as a line; whiskers represent range. (D) Representative plots of flow cytometry data to assess intracellular-cytokine production in proliferating CD3+CD8-cells (data given in Table 3). Statistical analysis was by (B) paired and (C) unpaired t-test.

