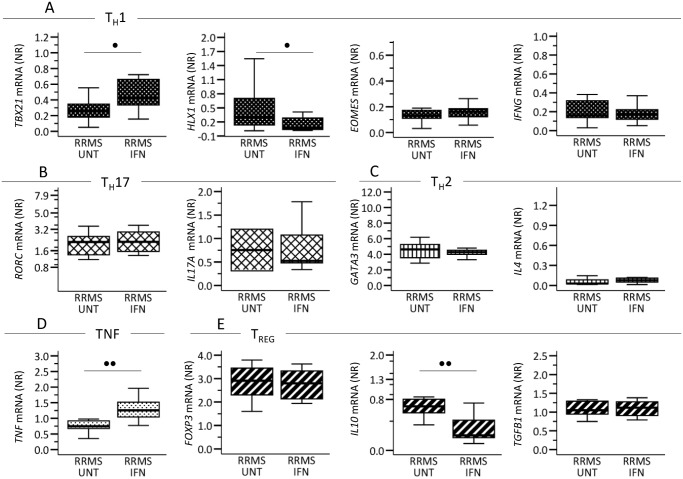
Fig 2. Circulating CD4+ T-cells’ in vivo mRNA expression of (A) T-helper (TH) 1, (B) TH17, (C) TH2, (D) TNF and (E) T-regulatory (TREG) associated molecules in 11 untreated (UNT) and 12 interferon(IFN)-β treated patients with relapsing-remitting multiple sclerosis (RRMS).
IFN-β treated patients were sampled 36–48 hours after injection of IFN-β. CD4+ T-cells were isolated by immunomagnetic labeling and separation. Gene expression levels are given as normalization ratio (NR), boxes represent interquartile range, median value indicated as a line; whiskers represent range. Studies were made on the sub-study 2 population. Statistics was by the Mann-Whitney U test. • = p<0.05, •• = p<0.005.

