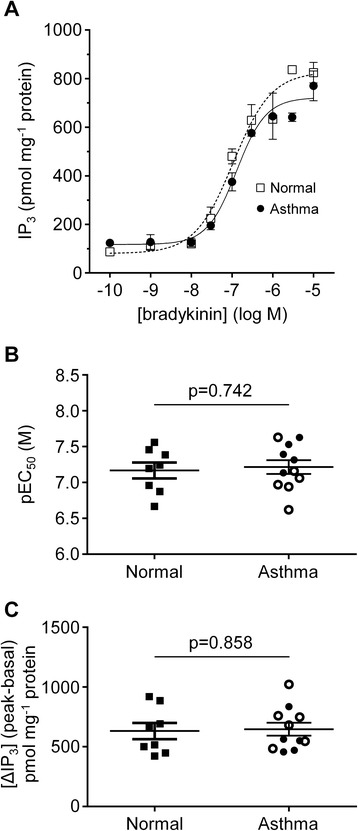
Figure 3.

Concentration-dependent IP 3 accumulation responses to bradykinin in ASM cells derived from asthmatic and non-asthmatic donors. (A) Representative examples of bradykinin concentration-response curves obtained for ASM cell monolayers from one asthmatic (○) and one non-asthmatic (▼) donor. (B) Graph showing the bradykinin concentrations causing a 50% of the maximal IP3 accumulation (shown as –log EC50 (M) values) in normal (n = 8) and asthmatic (n = 11) ASM donors. (C) The increase in IP3 accumulation following stimulation by a maximally effective concentration of bradykinin (10 μM) for ASM cells from non-asthmatic (n = 8) and asthmatic (n = 11) donors. Symbols key: filled circles: GINA 1–3; open circles: GINA 4–5; filled squares: non-asthmatic donors. Data are shown as mean (SEM) and analyzed by Student’s t-test.
