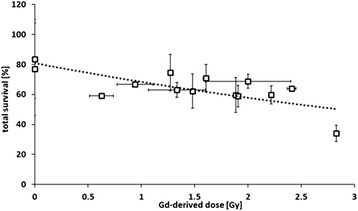
Figure 8.

Gd-related dose versus cell survival of F98 cells. Correlation of Gd-derived dose (dose rate minus dose rate of control group without Gd-supplementation) versus cell survival 97 h after irradiation of F98 cells treated with the respective formulation. Results are arithmetic means of three experiments, error bars represent SD (R2 = 0.4671).
