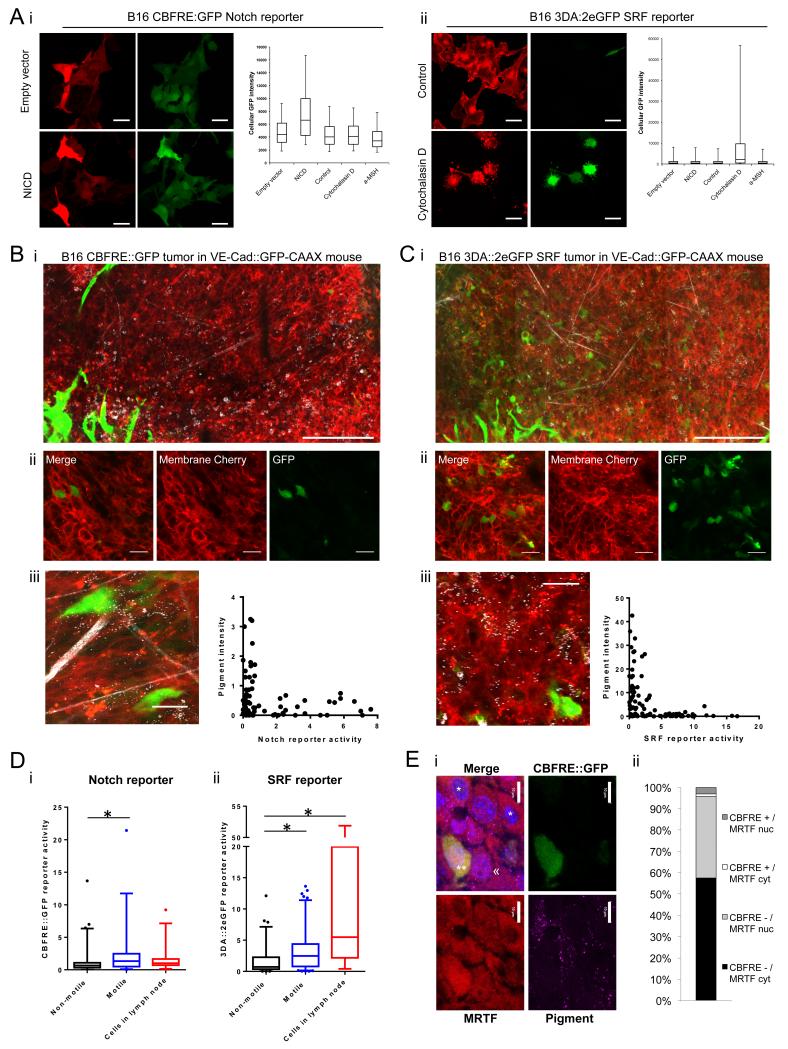
Figure 2. Notch and SRF signalling is increased in the singly motile cell population in vivo.
A. Confocal images and cellular fluorescence quantification of B16 F2 i) CBFRE::GFP Notch reporter and ii) 3DA::2eGFP SRF reporter cell-lines with membrane targeted mRFP in vitro. CBFRE::GFP Notch reporter co-transfected with empty-vector plus mCherry or NICD plus mCherry. 3DA::2eGFP SRF reporter cells serum starved for 8 hours before treatment with control or 5 μM Cytochalasin D for 16 hours. Scale bars indicate 30 μm. Plots of reporter fluorescence intensity after co-transfection of empty-vector and mCherry, NICD and mCherry, or mCherry and treatment with vehicle control, 5 μM Cytochalasin D, or 10 μM α-MSH. Reporter fluorescence intensity of mCherry transfected cells measured per cell by flow cytometry. Boxes show median and inter-quartile range and whiskers show 95th and 5th percentiles. Intravital confocal tile images of B) B16 F2 CBFRE::GFP Notch reporter and C) 3DA::2eGFP SRF reporter tumours with membrane targeted mRFP in VECad::GFPCAAX mice. Endothelial cells have green membranes, Collagen fibres and pigment in white. Scale bar indicates 200 μm. ii) Reporter tumours in C57Bl6J mice. Scale bar indicates 30 μm. iii) Quantification of cellular pigment and reporter activity in vivo on a cell-by-cell basis. Each data point represents a single cell, at least 60 cells quantified. D. Cellular reporter fluorescence intensity of non-motile and motile cells in primary tumour and cells in lymph node micrometastases from i) B16 F2 CBFRE::GFP Notch reporter tumours and ii) 3DA::2eGFP SRF reporter tumours. For primary tumour analysis, greater than 25 cells analysed from at least 6 movies of 3 mice. For lymph-node analysis at least 18 cells analysed from more than 4 mice. Boxes show median and inter-quartile range and whiskers show 95th and 5th percentiles. Outlying data points shown by dots. Star indicates p-value <0.05 in ANOVA test. E. i) Panels show MRTF/MKL staining (red), pigment (magenta), and CBFRE::GFP (green) staining of B16 CBFRE::GFP tumour. ** indicates a GFP positive cell with nuclear MRTF, << indicates a GFP negative cell with nuclear MRTF, * indicates GFP negative cells with cytoplasmic MRTF. Scale bar is 10μm. ii) Chart shows the proportion of cells in indicated categories. > 400 cells analysed from three tumours.

