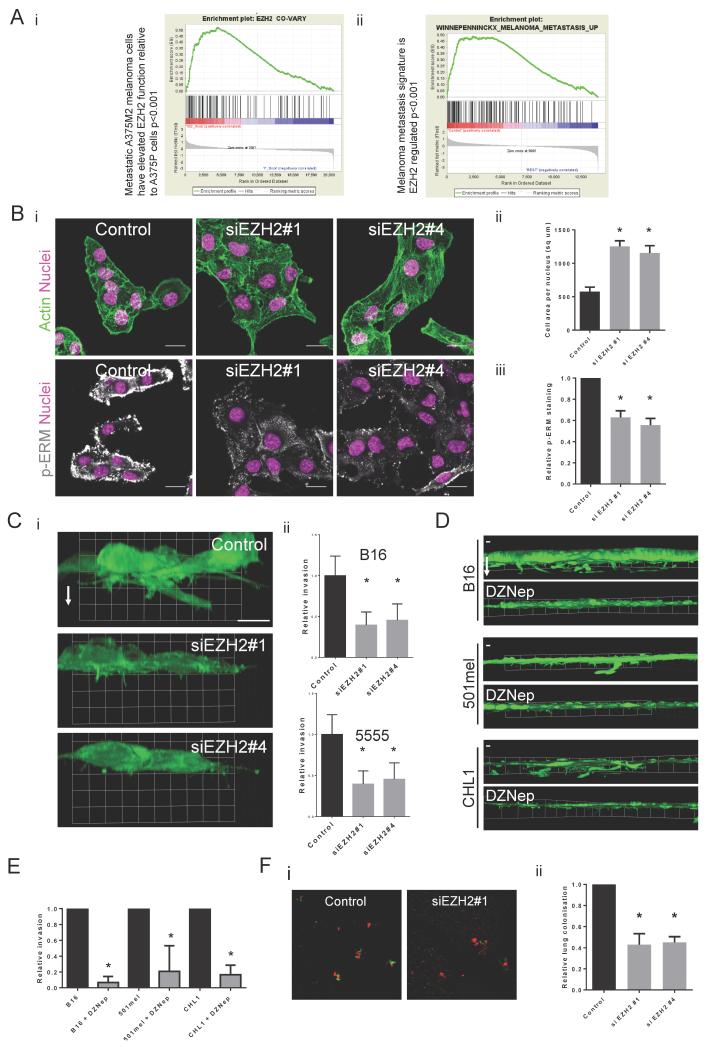
Figure 6. EZH2 promotes invasion and metastasis.
A.i). Genes that positively co-vary with EZH2 in a panel of melanoma cell-lines are enriched in the more metastatic A375 M2 cells. ii) Geneset enrichment analysis showing enrichment of the geneset “Genes up-regulated in melanoma patients who developed metastasis in 4 years” in control B16 cells compared to EZH2 siRNA treated cells. B.i) Confocal images of B16 cells after control and si EZH2 knockdown. Actin in green, DAPI in pink and phospho-ERM staining in white. Scale bar indicates 20 μm. ii) Quantification of B16 cell area after control and si EZH2 knockdown. Error bars show s.e.m of 3 experiments with 5 images each experiment. iii) Quantification of phospho-ERM immunostaining in B16 cells after control and si EZH2 knockdown. Error bars show s.e.m of 2 experiments with 4 images each experiment. C.i) ‘Side-on’ 3D re-constructions of F-actin images of B16 cells transfected with control or EZH2 siRNA plated on collagen/matrigel matrices. White arrow indicates direction of invasion. Grid units are 13μm. ii) Graphs showing relative invasion into collagen/matrigel matrices after control and si EZH2 smartpool knockdown in mouse B16 and 5555 melanoma cells. Error bars show standard deviation. n=3 mean and s.d. shown. D. ‘Side-on’ 3D reconstructions of B16, 501mel and CHL1 cells treated with either DMSO or 2μM DZNep plated on collagen/matrigel matrices. White arrow indicates direction of invasion. Grid units are 50μm. E. Graphs showing relative invasion into collagen/matrigel matrices of B16, 501mel and CHL1 cells after DMSO and 2μM DZNep treatment. n=4 mean and s.d. shown. F.i) Confocal images of lungs after I.V injection of a 50:50 mix of red B16 F10 control cells and green B16 F10 control or EZH2 knockdown cells. Scale bar indicates 200 μm. ii) Graph showing relative lung colonisation of B16 F10 cells after control and si EZH2 knockdown. Error bars show s.e.m of at least 6 mice. Star indicates p-value <0.05 in ANOVA test.

