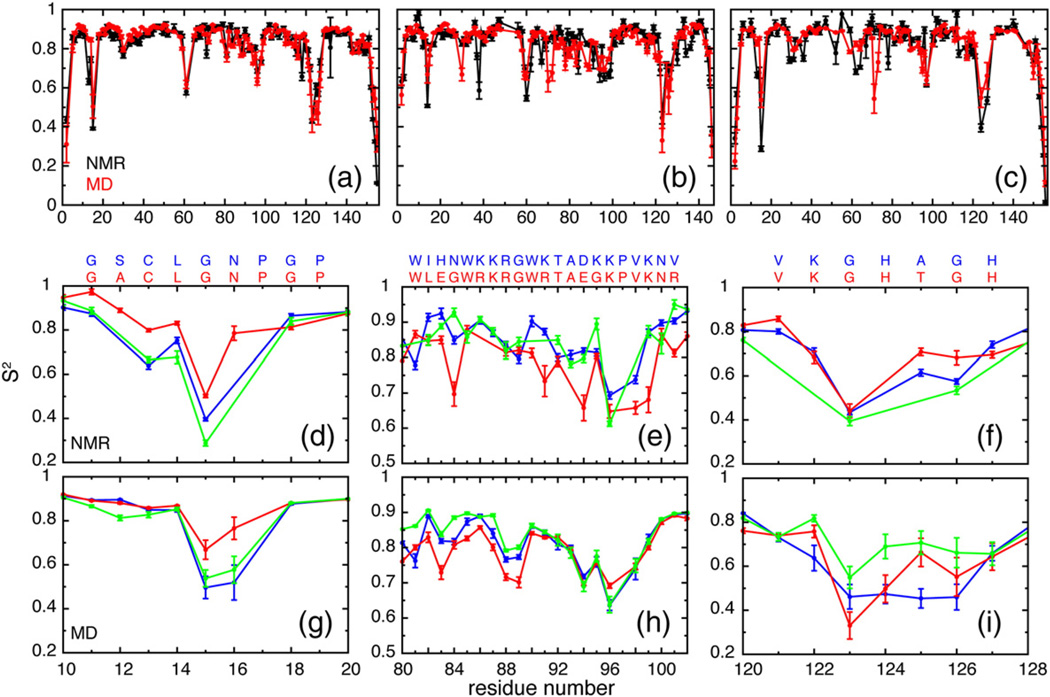
Fig. 2.
Experimental and simulated order parameters. Full sets of (black) experimental and (red) simulated order parameters for (a) ecRNH, (b) ttRNH, and (c) iG80b ecRNH. Comparison of (d) experimental and (g) simulated order parameters in the glycine-rich region (residues 11–22). The sequence alignment between WT ecRNH (blue) and ttRNH (red) in this region is shown at the top. Comparison of (e) experimental and (h) simulated order parameters in the handle region (residues 81–101). Comparison of (f) experimental and (i) simulated order parameters in the β5/αE loop (residues 121–127). Color coding in (d–i) is (blue) ecRNH, (red) ttRNH, and (green) iG80b ecRNH. The sequence alignment between (blue) ecRNH and (red) ttRNH in each region is shown at the top of (d–f). The sequence of iG80b ecRNH differs from WT by insertion of a glycine residue N-terminal to W81.

