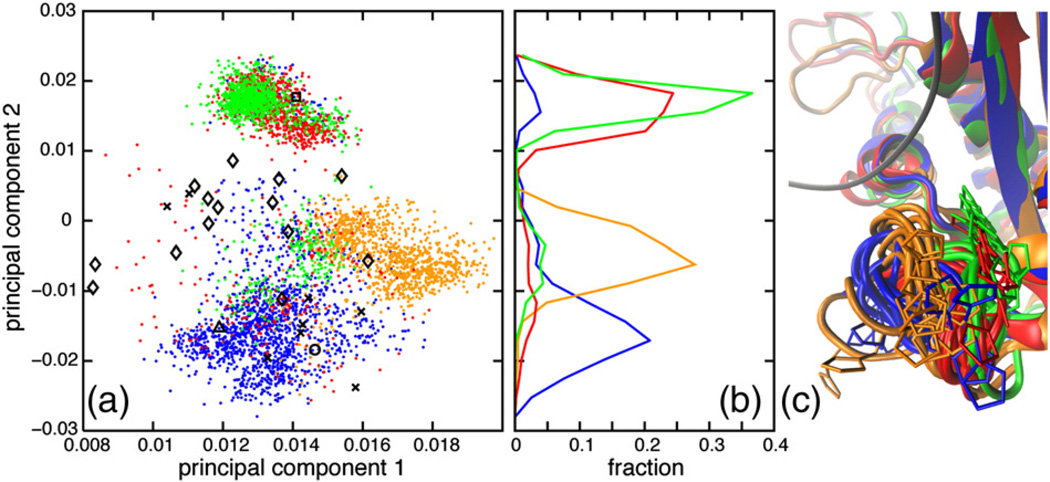
Fig. 7.
β5/αE-loop conformational dynamics. (a) PCA was conducted using the backbone dihedral angles ϕ and ψ of the β5/αE loop (residues 121–127). (b) Distributions of MD conformations along the second principal component are also shown. (c) Conformations were extracted from MD simulations in 10-ns intervals, after backbone heavy-atom superposition with respect to a holo hsRNH crystal structure (PDB code 2QK9). The RNA strand from that hsRNH crystal structure is shown as a gray ribbon. Color coding and symbolic representations are as described for Fig. 3.

