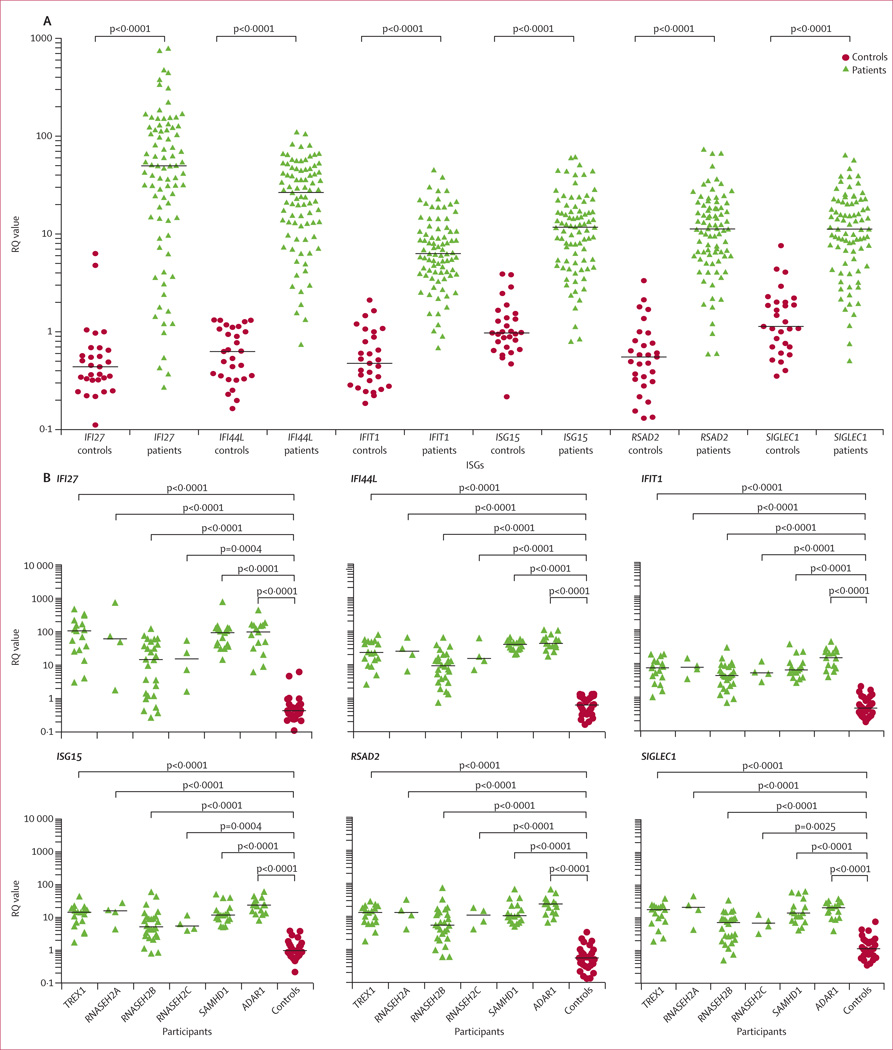
Figure 1. ISG transcript levels in patients and controls.
(A) Quantitative reverse transcription PCR of a panel of six ISGs in whole blood measured in 82 patients with Aicardi-Goutières syndrome and 29 controls. Horizontal black bars show the median RQ value for each probe in each group. For participants with repeat samples, the mean combined measurement is shown. Analysed with one-way ANOVA with Bonferroni’s multiple comparison test. (B) ISG RQ by genotype compared with controls. Horizontal black bars show the median RQ value for each probe in each group. Analysed with one-way ANOVA with Dunnett’s multiple comparison test. ISG=interferon-stimulated gene. RQ=relative quantification.

