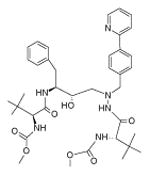
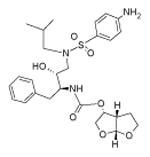
Table 1. Molecular structure and pH-dependent hydrophobicity of atazanavir and darunavir.
| Hydrophobicity | pH | Atazanavir (ATV) | Darunavir (DRV) |
|---|---|---|---|

|

|
||
|
| |||
| Log D (measured)a | 3 | 3.40 ± 0.31 | 2.98 ± 0.02 |
| 5 | 4.66 ± 0.27 | 2.80 ± 0.02 | |
| 7.4 | 5.77 ± 0.03 | 2.84 ± 0.07 | |
|
| |||
| XLogP3-AA (estimate)b | 5.6 | 2.9 | |
|
| |||
| pKac | 4.42, 11.92 | 2.39, 13.59 | |
Distribution coefficient, log D, was measured as described in Materials and Methods for each pH value and presented as a mean ± SD of triplicates.
Theoretical estimates were derived from the PubChem database (ref: http://pubchem.ncbi.nlm.nij.gov; http://www.sioc-ccbg.ac.cn/software/xlogp3).
Drug bank data, estimated by ChemAxon (ref: http://www.drugbank.ca/drugs/DB01072 for ATV; http://www.drugbank.ca/drugs/DB01264 for DRV)
