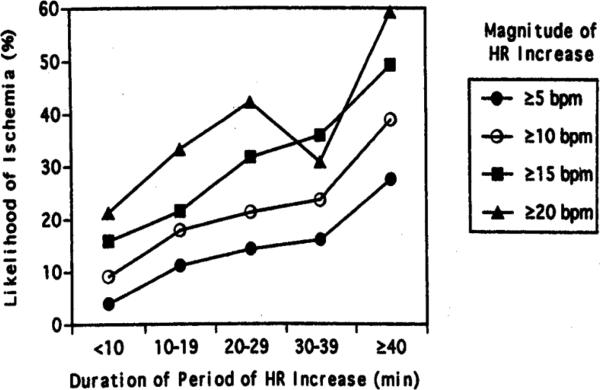
Figure 2.
Graph showing likelihood of developing ischemia after a heart rate increase by the duration and magnitude of the preceding heart rate increase. Likelihood of developing ischemia was directly proportional to both the magnitude and duration of heart rate increases (p<0.001). HR represents heart rate; bpm represents beats per minute. (from Andrews et al. [18])

