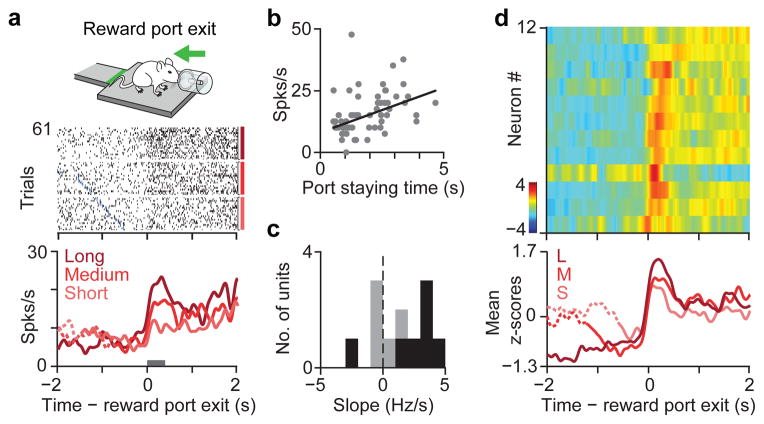
Figure 4. Pv interneurons in ACC signal stay duration at foraging decisions.
a, Mouse exiting the reward port (inset). Response of a Pv neuron during reward port exit. Raster is sorted by staying time in the port and grouped into terciles. Blue ticks denote water valve offset. PETH is shown for each tercile. b, Linear regression between firing rate of neuron in (a), (epoch indicated by a gray bar) and staying time is significantly positive (r=0.16, slope, 3.63, P<0.005). c, Histogram of regression slopes for all Pv neurons. Black bars indicate significant (P < 0.05) regression. d, Top, z-scored PETHs of 12 Pv neurons aligned to reward-port exit sorted according to latency of half-peak firing. Bottom, average PETH for Pv population grouped into staying time terciles.

