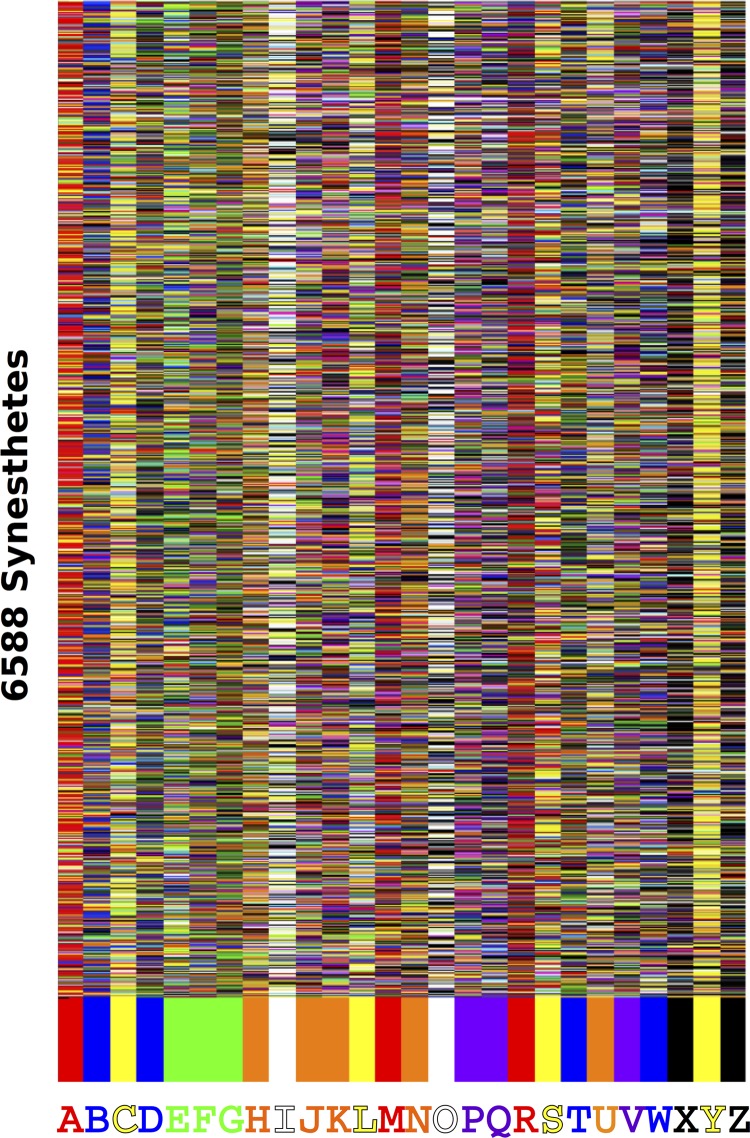
Fig 1. Grapheme-Color synesthesia in 6588 participants.
The letter-color pairings across the whole population are shown with rows corresponding to participants and columns to letters. The colors along the bottom represent the most frequently chosen (modal) color label for each letter after interpolating from subject’s RGB coordinates to labels. Letters not assigned a color by participants are given a random color.

