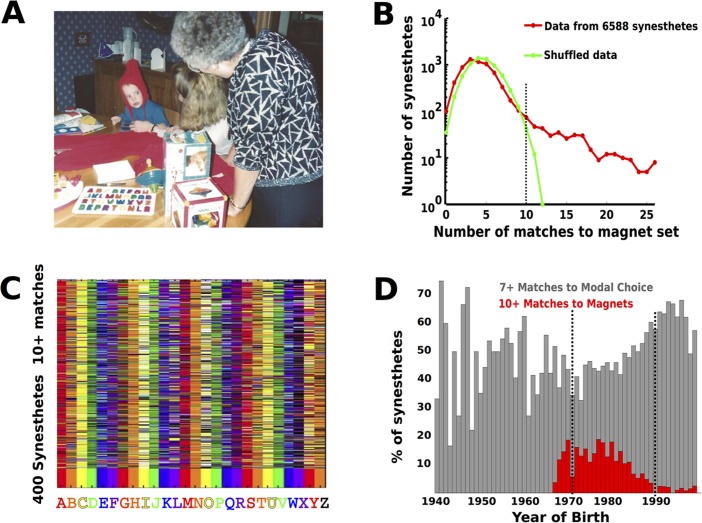
Fig 2. Prevalence of learned synesthesia in the sample.
A. Photograph of the Fisher-Price letter set owned by a child who is now an adult synesthete with colors influenced by the toy. This participant was born in 1988 and has 25 matches to the colors in the toy. B. Histogram of the number of letter matches to the colors in the toy. The red curve shows the matches found in the empirical data while the green curve is derived from the shuffled data. In the shuffled distribution, the number of matches to the toy rarely exceeds 10 of 26 (black dashed line). In the empirical distribution, it can be as high as 26 of 26. C. Same as Fig. 1, except it shows only the 400 synesthetes with 10 or more letters matching the toy (those to the right of the black dashed line in panel B). D. Prevalence of magnet and modal matching over time. Red bars show proportion of participants with 10 or more matches to the magnet set as a function of year born. Grey bars show participants with 7 or more matches to modal choices. For participants born between 1970 and 1985, the prevalence of synesthesia apparently learned from the Fisher-Price set can exceed 15%.

