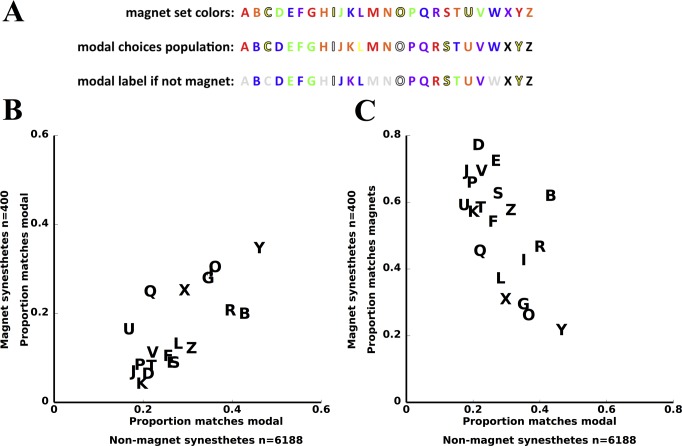
Fig 4. Synesthetes with learned matches are subject to the same influences as the larger population.
A. The colors in the toy (upper row), the modal color choice for each letter from the 6188 synesthetes (middle row), and the most commonly assigned color for each letter for the 400 synesthetes from Fig. 2C, when the choice does not match the toy (bottom row). Letters for which the magnet set color is the same as the modal color for all synesthetes are indicated in gray. When the 400 synesthetes have letter color matches that don’t match the toy, they generally follow the same pattern as the rest of the population (15/20 letters the same). B. Relationship between the probability that a letter is matched to the modal choice in the 400 synesthetes from Fig. 2C and the other 6188 synesthetes. The strong positive correlation indicates that the two populations are subject to similar influences. C. Correlation between the probability that a latter matches the magnet set in the 400 synesthetes and the probability a letter matches the modal choice in the other 6158 synesthetes. The negative correlation signals competition between the two sources of influence in the magnet synesthetes, the toy versus general cultural/linguistic tendencies. Analyses in this section are limited to the subset of 20 letters which are not same for the magnet set and modal choice (excludes A, C, H, M, N, and W; grayed out in the bottom row of panel A).

