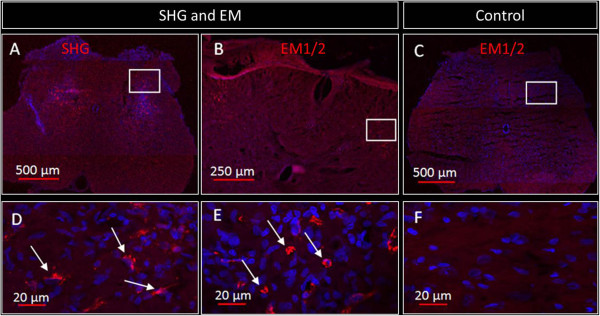
Figure 8.

Immunohistochemical detection of SHG and EMs in the spinal cord of treated rats. Representative images of immunostained spinal cord sections from animal transduced with viral vector as indicated above the image (A-B) two weeks after SCI show expression (red fluorescence) of SHG (A) or EM 1/2 (B). Spinal cord of a control untransduced animal immunostained with endomorphin antibodies is shown in C. Panels D, E, and F represent the higher magnification of rectangles of A, B and C, respectively. Arrows indicate some of the expressing cells.
