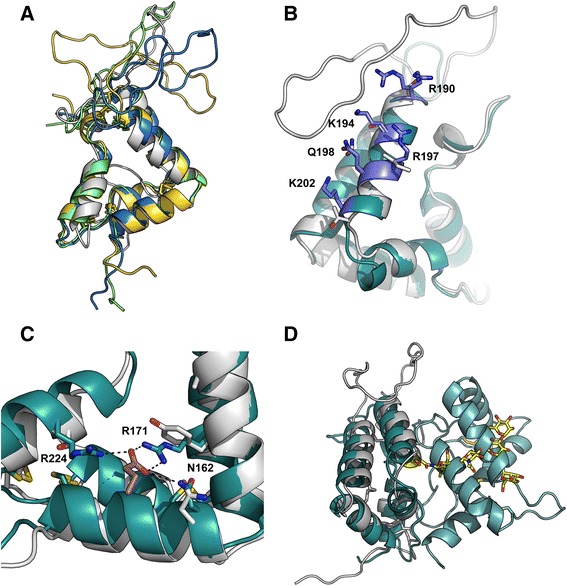
Figure 2.

Homology modelling of human GAS1 and comparison to GDNF receptor structures. A) Four representative homology models of GAS1 N-terminal domain showing different orientations and flexibility of the extended intradomain loop of higher vertebrate proteins. The models were generated with the Raptor-X server, as mentioned in the text. The template for modelling was the GFRα1 structure (PDB: 2VE5). B) comparison to N-terminal domain of GFRα1 (dark cyan) and N-terminal domain (GAS1, grey) and RET/heparin binding site (grey residues, GAS, cyan residues, residues involved in heparin and indicated as putative RET binding residues). GFRα1 RET/heparin binding-site residues are labelled. C) The GDNF binding site residues GFRα1 (dark cyan) vs. GAS1 (grey). The GDNF Glu binding to the GFRα1 is colored brown, and hydrogen bonds are indicated with dashed lines. A Tyr and Ser residue occupy the positions in GAS1 equivalent to GFRα1 Arg171 and 224, GFRα1 GDNF binding residues are labelled. Disulphides in the figure are shown with stick presentation and atoms S atoms in yellow D) Position of the N-glycosylation site in GAS1 vs. GFRα1 domain interface of domains D2 and D3. N-glycan at Asn117 of GAS1 is indicated in yellow with a stick presentation, the GFRα1 D2 and D3 domains are depicted in dark cyan, GAS1 N-terminal domain is drawn in grey.
