Figure 3.

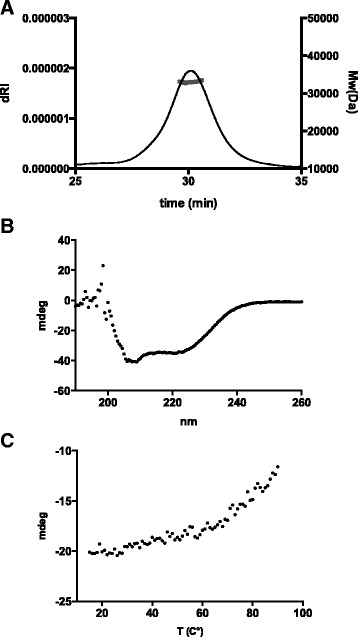
GAS1 analytical gel filtration, circular dichroism and thermal unfolding. A) GAS1 sample was run on Superdex 200 10/300 gel filtration column in TBS at 0.5 ml/min, at protein concentration of 1 mg/ml. A single major peak at 30 min (X-axis) eluted and based on multi-angle light scattering had molecular weight (right Y-axis) of ca. 33 kDa, matching relatively well with theoretical molecular weight of the monomer. The peak is plotted as a function of dRI signal (left Y-axis). B) The CD spectrum of GAS1 and C) the residual thermal denaturation of GAS1 as monitored by CD at 222 nm.
