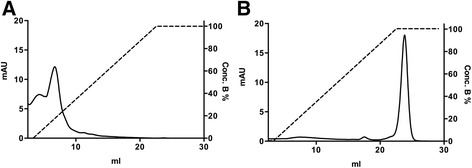
Figure 5.

Heparin affinity chromatography of GAS1. A) Elution of GAS1 as a function of salt concentration. B) Elution of HBGAM as a function of salt concentration. Chromatograms are plotted with absorbance in mAU unit (right y-axis) and salt concentration gradient to 1 M NaCl (%) (left y-axis), against volume in ml.
