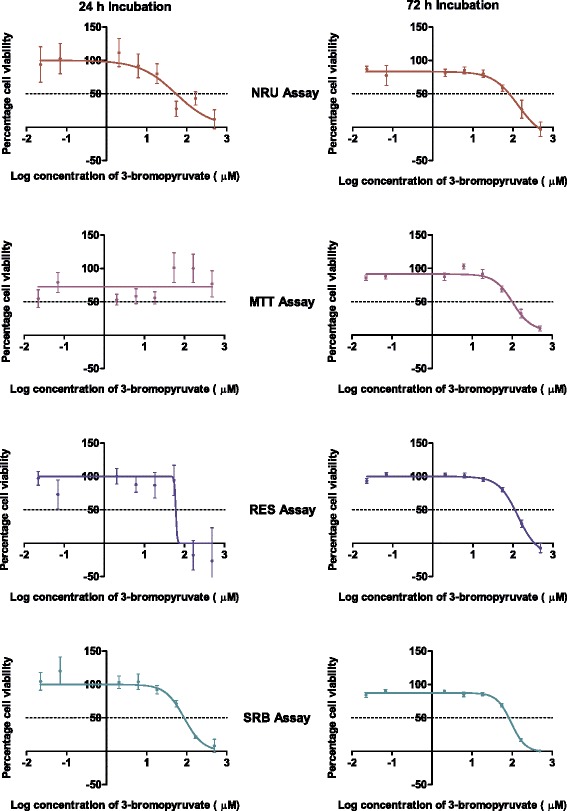
Figure 2.

The effect of 3-bromopyruvate on the growth of MCF-7 cells. The graphs represent results obtained after 24 and 72 hours incubation as assayed by the four cell enumeration assays. Note that the error bars are smaller in the 72 hour incubation graphs and in many of the data points fall within the symbol (n = 3).
