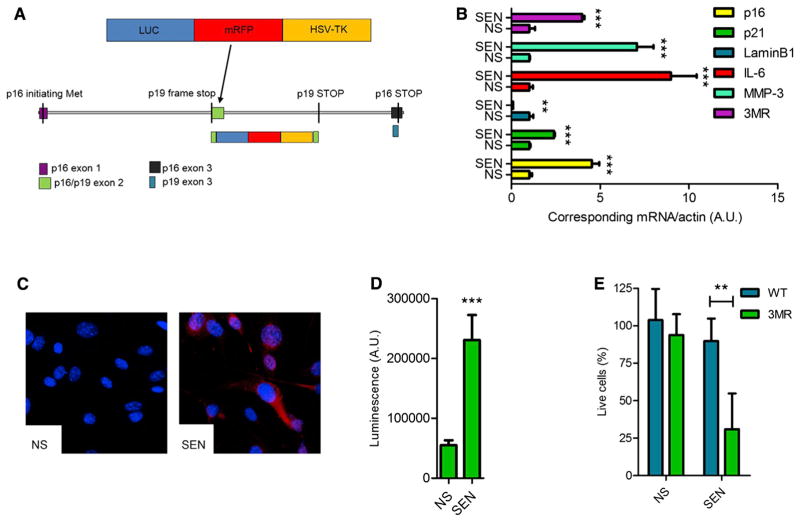
Figure 1. Characterization of p16-3MR Cells.
(A) Schematic of the p16-3MR transgene. See Results and Supplemental Experimental Procedures for details.
(B) qRT-PCR analysis of RNA isolated from nonsenescent (NS) and senescent (SEN; induced by 10 Gy IR) MEFs derived from p16-3MR embryos. RNA was analyzed for mRNA levels of the indicated genes relative to actin mRNA (control for cDNA quantity) (n = 3 independent experiments; A.U., arbitrary units).
(C) Immunofluorescence of cells described in (B). Blue shows DAPI-stained nuclei; red shows mRFP immunostaining.
(D) Luminescence measurements of cells described in (B). Cells were incubated with coelentarazine and lysed, and luminescence intensity was quantified using a luminometer (n = 3; A.U., arbitrary units).
(E) WT or p16-3MR MEFs were treated with GCV (10 μg/ml) for 7 days and evaluated for the percentage of surviving cells using the MTS assay (n = 4).
Data shown are the mean ± SD. **p < 0.01, ***p < 0.001.

