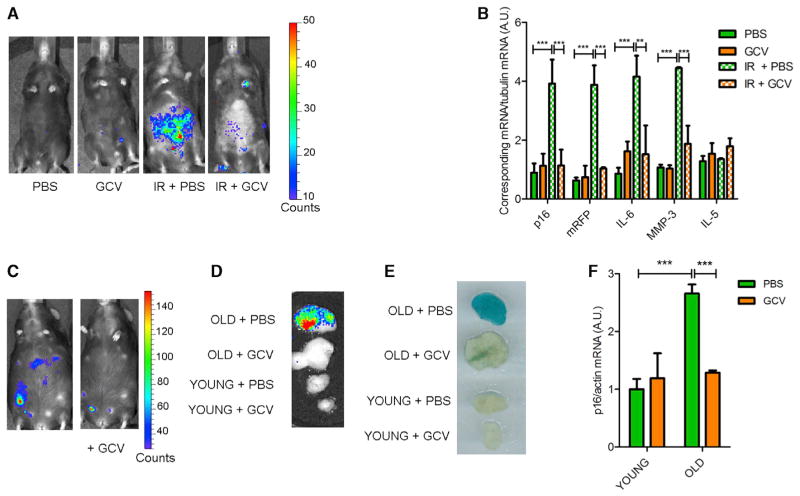
Figure 2. Characterization of p16-3MR Mice.
(A) Mock or IR p16-3MR mice, treated with vehicle (PBS) or 25 mg/kg of GCV for 5 days (daily i.p. injections; GCV), were injected with coelentarazine, and luminescence was quantified using a Xenogen Imaging system.
(B) RNA was extracted from the fat of mice described in (A) and quantified by qRT-PCR for mRNA levels of endogenous p16INK4a, mRFP, IL-6, MMP-3, and IL-5. Tubulin mRNA was used as a control (n = 4).
(C) Representative image of a 24-month-old p16-3MR mouse before (left) and after (right) GCV treatment. Luminescence was quantified using a Xenogen Imaging system.
(D–F) Fat biopsies from old (20–24 months) or young (3–4 months) p16-3MR mice, treated with PBS or GCV as described in (A). (D) Biopsies were incubated with a coelentarazine solution and luminescence quantified using a Xenogen Imaging system. (E) Biopsies were fixed in formalin, stained at pH 6 with X-Gal solution to measure SA-β-gal activity, and recorded using a photoscanner. (F) RNA was extracted from the biopsies and quantified by qRT-PCR for mRNA levels of endogenous p16INK4a. Actin mRNA was used as a control (n = 4).
Data show are the mean ± SD. **p < 0.01; ***p < 0.001.

