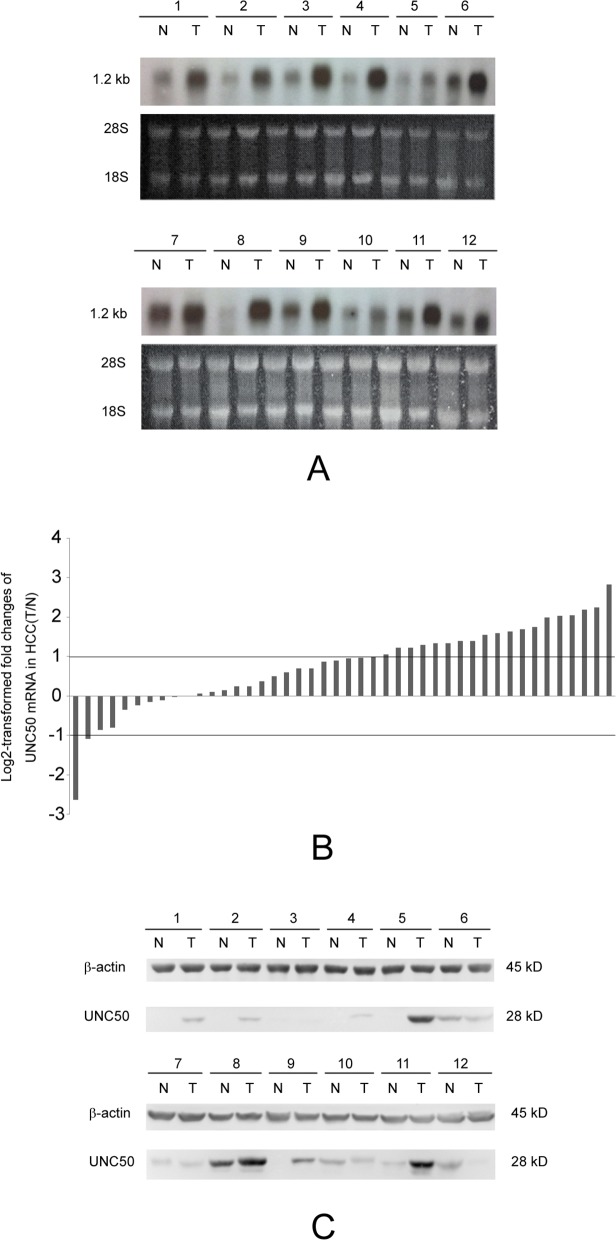
Fig 1. Increased UNC50 expression in HCC.
(A) Northern blotting analysis of UNC50 mRNA expression levels in 12 paired HCC tissues (T) and adjacent non-cancerous tissues (N); 28S and 18S bands were used as the references. (B) Real-time PCR analysis of UNC50 expression levels in 44 paired tissues. Relative mRNA expression levels are normalized to β-actin; log2-transformed fold changes of HCC tissues compared to the adjacent non-cancerous tissues were calculated by the comparative cycle threshold (ΔΔCt) method. The paired tissues are ordered from low to high ΔΔCt values. Cutoff values were set to ±1 to identify the significance of changes. (C) Western blotting analysis of UNC50 levels in another 12 paired HCC tissues; β-actin was used as the reference.

