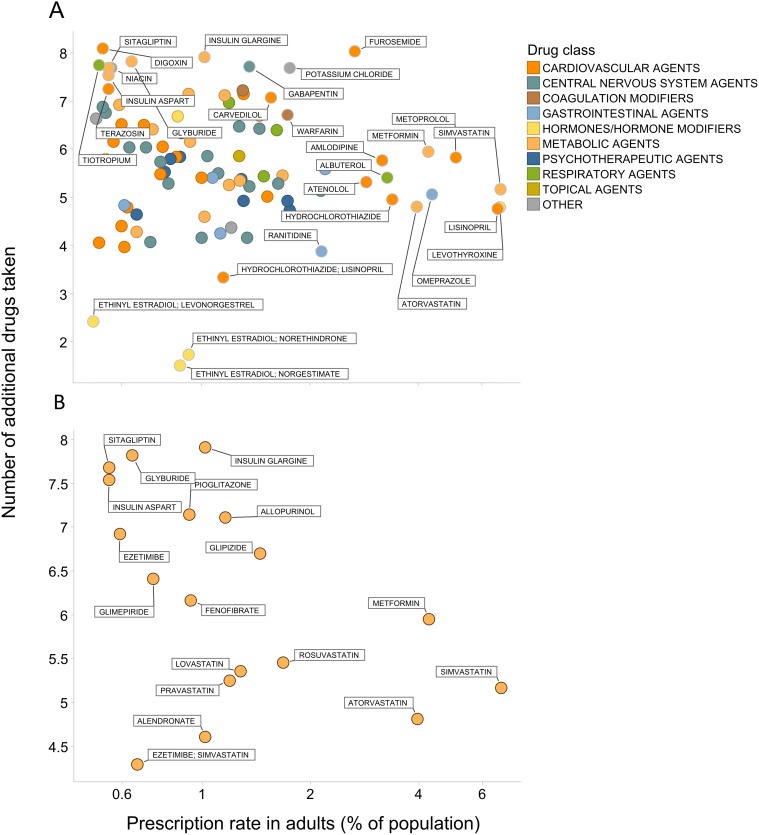
Fig 2. Co-prescription rates relative to drug prescribing frequency.
Percent of adult subjects taking a given prescription medication (X-axis) vs. average number of co-taken drugs (Y-axis). Only medications taken by 0.5% of the adult population or more are shown. A) all drugs, B) only metabolic agents. The X-axis is shown on a log scale to improve clarity.

