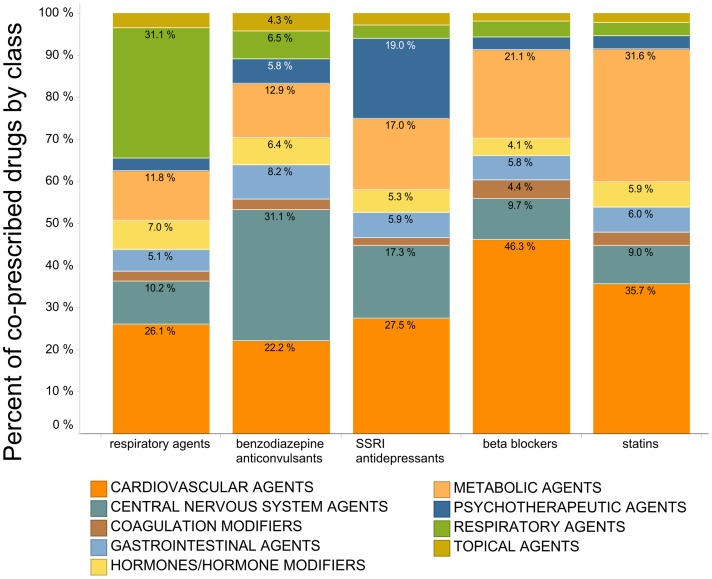
Fig 3. Co-prescription rates by therapeutic indication.
Co-prescribed drugs categorized by drug class for all adults in the 2009–2010 NHANES dataset. For the 3 most prescribed drugs in each of the five classes shown, the distribution of classes for additional co-prescribed drugs is shown. Color-coding by therapeutic indication is represented as indicated in legends. For clarity, the drug classes ‘alternative medicines’, ‘anti-infectives’, ‘antineoplastics’, ‘biologicals’, genitourinary tract agents’, ‘immunologic agents’, ‘miscellaneous agents’, ‘nutritional products’, taken by fewer than 10% of elderly subjects, are removed.

