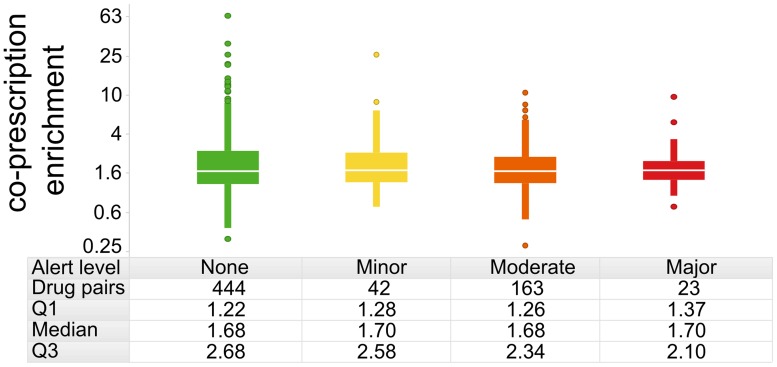
Fig 6. Enrichment in co-prescription rate vs. Drugs.com alert level.
The enrichment metric calculates whether a given drug pair is prescribed at a different rate than expected if the two drugs are used independently. For drug pairs that are actively avoided, enrichment values should be < 1. The enrichment metric is plotted on a log10 scale to normalize its distribution. None of the pairwise comparisons across alert categories are statistically significant (p > 0.05 via two-sided t-tests).

