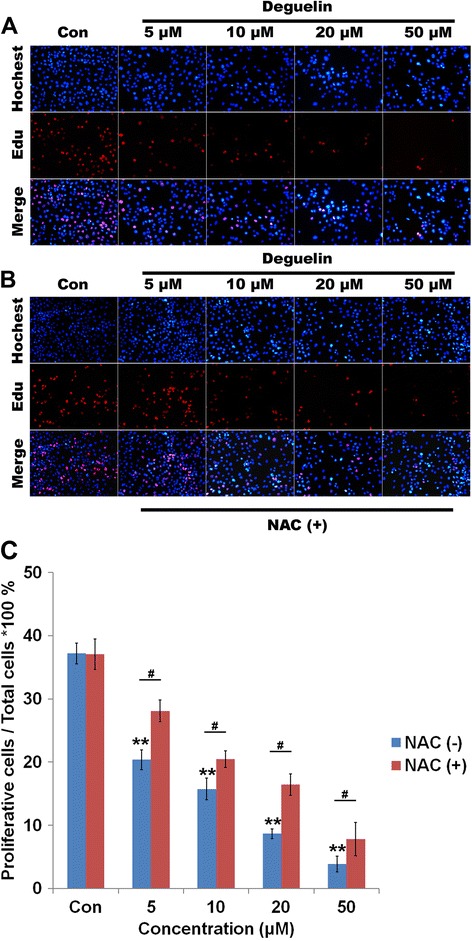
Figure 2.

Influence of Deguelin on the cell proliferation. A: Hoechest and Edu dual staining of NCI-1975 cells under the treatment of a series of Deguelin with or without the presence of NAC. A: Image of dual staining of cells treated by Deguelin only. B: Image of dual staining of cells treated by Deguelin with the presence of NAC (500 μM). C: Quantification of proliferative cells under the treatment of Deguelin with or without the presence of NAC. # represents p < 0.05 vs the corresponding dose between cells without and with the treatment of NAC. ** represents p < 0.01 vs the control cells. Data are presented as mean ± SD (n = 3).
