
Figure 2.
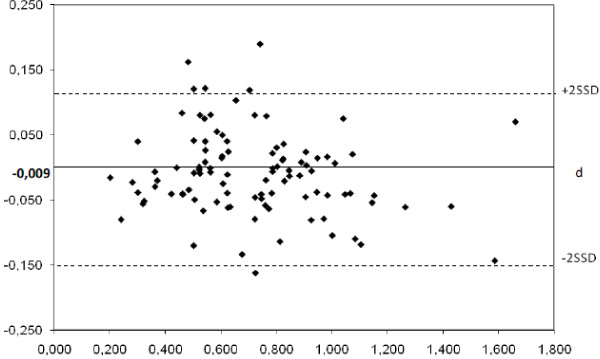
Evaluation of non-inferiority between manual and automated scoring for total aneuploidy rate by Bland-Altman plot. Each of the paired measures is represented by assigning the average of the two rates in abscissa and the difference between the two measurements in ordinate (d = -0.009; 2SSD = 0,127).