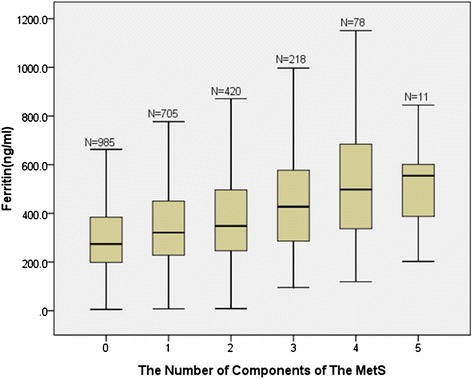
Figure 1.

Distribution of ferritin levels according to the numbers of components of the MetS. The ferritin level had a growing trend when the number of MetS components increased in groups (p < 0.001).The bars represent median, 25th, and 75th percentile of ferritin.
