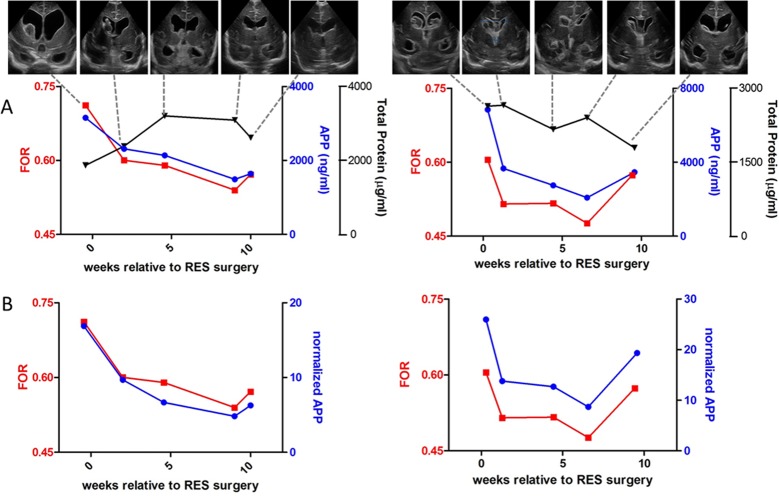
Fig 2. FOR and APP levels.
A.FOR measurements (red left y-axis) and absolute APP concentrations (blue right y-axis) and total protein (black right y-axis) plotted versus relative time of reservoir surgery in selected timepoints of patients #7 (left) and #8 (right). Each FOR data point is accompanied by an US image for the selected patient at that particular timepoint. The image shown is a coronal slice taken at the foramen of Monro. B. FOR measurements (left y-axis) and normalized APP levels (right y-axis) plotted versus relative time of reservoir surgery in selected timepoints of patients #7 (left) and #8 (right).

