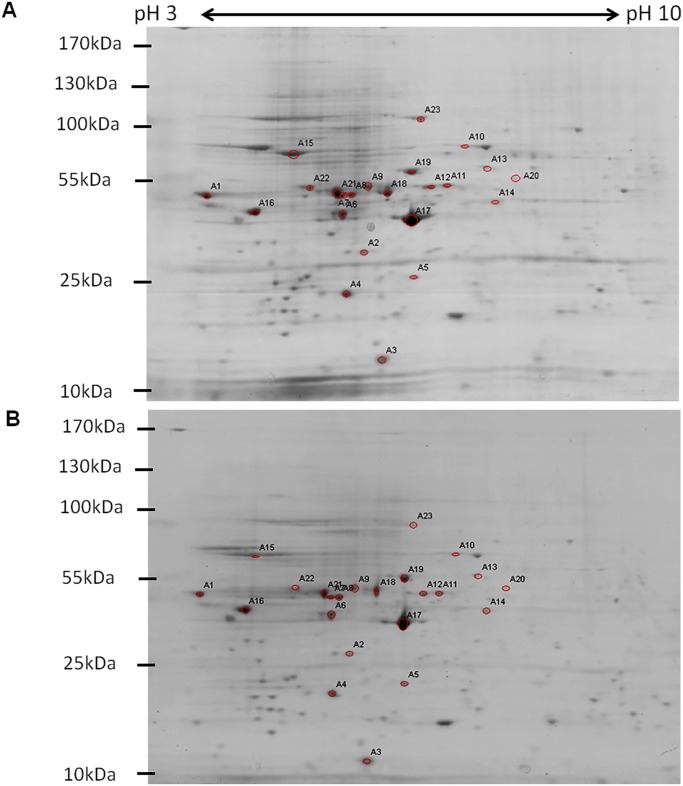
Fig 1. 2DE analysis of CHIKV-infected C6/36 cells.
(A) Twenty-three protein spots of mock-infected samples that showed 2-folds changes with p<0.05 (Student’s t-test) as compared to (B) CHIKV-infected samples were annotated. All the SDS-PAGE gels from the second dimension separation were analyzed using PDQuest 2-D Analysis Software (BioRad). Two biological replicates of the CHIKV-infected samples from each time-point infection were grouped and compared against to the corresponding biological replicates of the mock-infected samples. Representative gels are from 24h mock-infected and 24h CHIKV-infected lysates.

