
Figure 2.
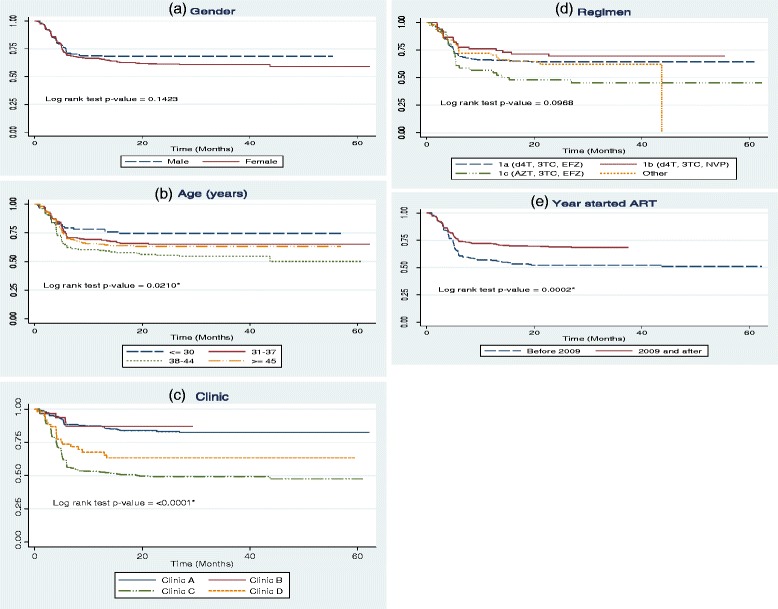
Kaplan Meier curves for time to first ADRs among HIV patients on ART, South Africa 2007–2012 classified by (a) gender, (b) age, (c) clinic (d) regimen and (e) Year started ART. HIV.
Official websites use .gov
A
.gov website belongs to an official
government organization in the United States.
Secure .gov websites use HTTPS
A lock (
) or https:// means you've safely
connected to the .gov website. Share sensitive
information only on official, secure websites.
Kaplan Meier curves for time to first ADRs among HIV patients on ART, South Africa 2007–2012 classified by (a) gender, (b) age, (c) clinic (d) regimen and (e) Year started ART. HIV.