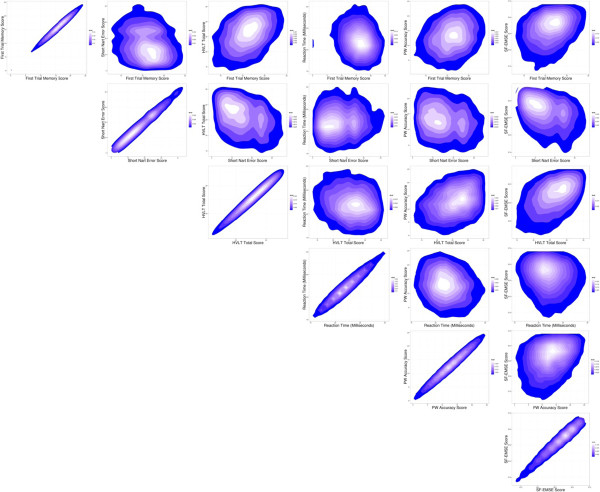
Figure 4.

Contour plots to show relationship of data from EPIC-COG battery. The contours represent the strength of the relationship between the scores of the test components. The first plot (on the left) in each row shows the outcome measure variable of each individual test plotted against itself depicting the perfect positively linear association.
