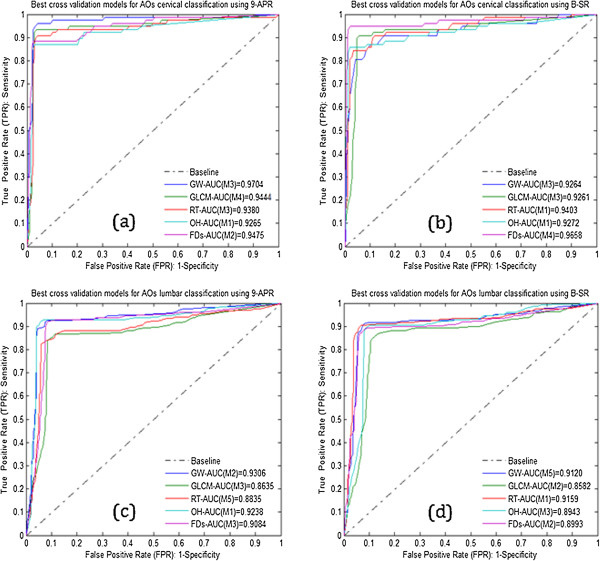
Figure 10.

ROC plots of the PMCVNN classification results of the DB1, DB2, DB3 and DB4 datasets. Average classification results of the (a) DB1 (b) DB2 (c) DB3 and (d) DB4.

ROC plots of the PMCVNN classification results of the DB1, DB2, DB3 and DB4 datasets. Average classification results of the (a) DB1 (b) DB2 (c) DB3 and (d) DB4.