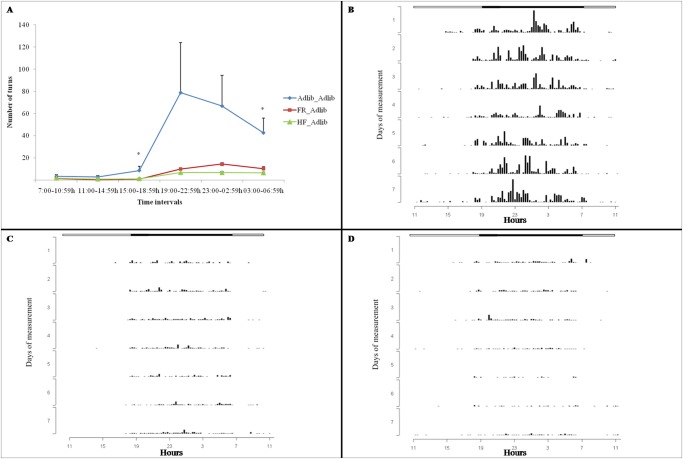
Fig 4. Number of wheel turns (physical activity) by males.
Data are expressed as mean ± SEM (A) and plotted as actograms: (B) Adlib_Adlib, (C) FR_Adlib, (D) HF_Adlib. (A) * Extreme groups (FR_Adlib and HF_Adlib) were less active than the reference group (Adlib_Adlib) (GEE, p<0.001; Bonferroni post hoc test, p<0.05; n = 7–9/group). (B) (C) (D) Actograms: wheel-running activity rhythms are shown as bars representing 15 minutes. Time of the day is indicated on the X axis and number of days on the Y axis. Horizontal white and black bars above the actograms indicate the duration of the light and dark phases, respectively, of the light-dark cycle.

