
Fig 4. Histogram of the two imaging features across cohorts.
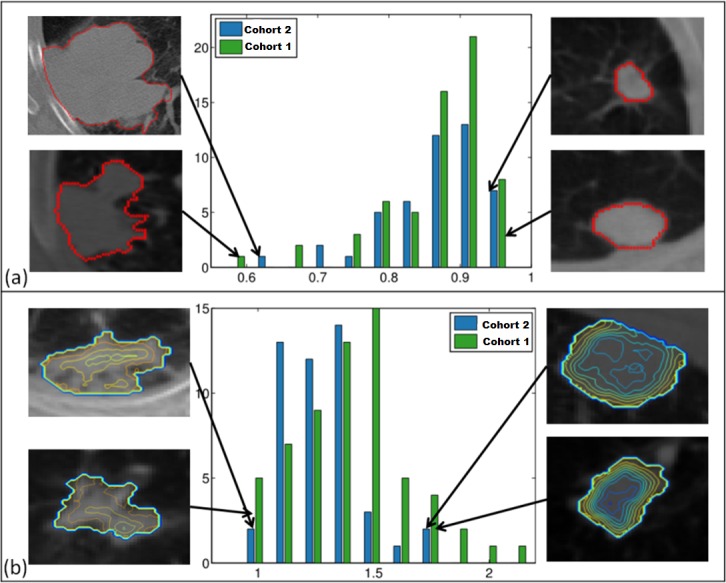
Convexity (a) shows similar range across cohorts (training-green, test-blue) However, training cohort is enriched with round tumors. The range of values for entropy ratio feature (b) is larger in training cohort. Both convexity (a) and entropy ratio (b) consistently capture targeted tumor characteristics in both cohorts.