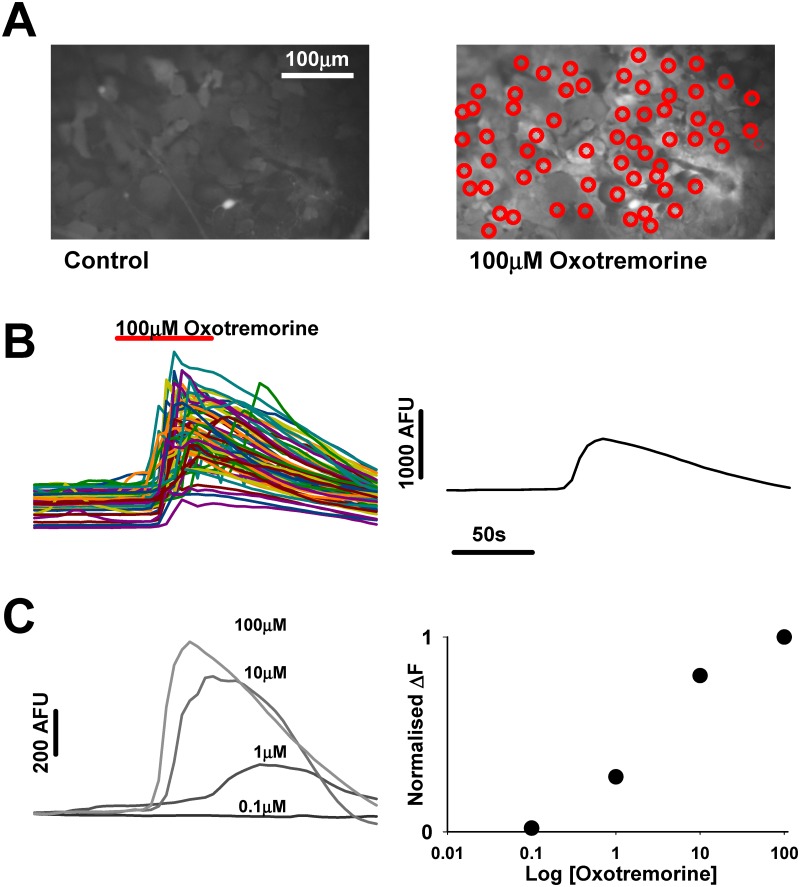
Fig 1. Determination of agonist effect on NT2A cultures.
A. Images of field of astrocytes before (left) and during (right) 100μM Oxotremorine application. Red circles indicate regions of interest (ROI’s) from which fluorescence (AFU-arbitrary fluorescence units) over time are sampled. B. Plot of fluorescence over time showing the effect of oxotremorine on the circled astrocytes in A. Plot on the right displays the average of the astrocyte fluorescence over time. C. Average of fluorescence traces from the same ROI’s to 0.1,1,10 and 100μM oxotremorine. Plot on the right displays the normalised change in fluorescence from the traces on the right to give the dose response relationship.

