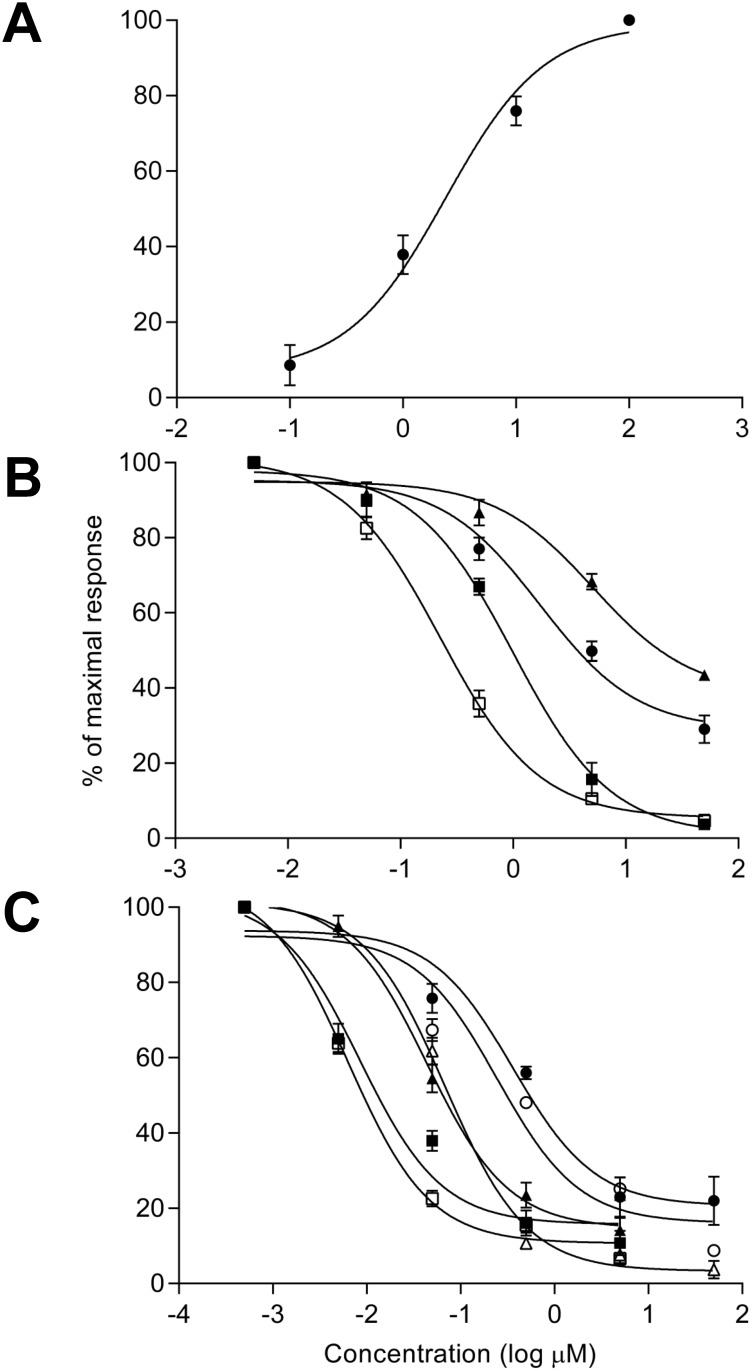
Fig 5. Effects of anticholinergic agents on NT2.N/A culture responses to the cholinergic agonist oxotremorine.
A) Effect of perfusion of NT2.N/A cultures with oxotremorine for 1 min on release of Ca2+ from astrocytic membrane bound stores; showing a sigmoidal log concentration-response curve for [Ca2+]i increase in the NT2 astrocytes. B) Inhibition of the astrocytic response to the EC50 concentration of oxotremorine by single anticholinergic drugs, Sigmoidal log concentration—response curves for inhibition of the [Ca2+]i increase in the NT2 astrocytes in response to increasing concentrations of antagonist; dicycloverine (□ open square), amitriptyline (■ solid square), cyclobenzaprine (● solid circle) and cimetidine (▲ solid triangle). C) Comparison of the inhibition of the astrocytic response to the EC50 concentration of oxotremorine by anticholinergic drugs in combination. Sigmoidal log concentration—response curves for inhibition of the [Ca2+]i increase in the NT2 astrocytes in response to increasing concentrations of antagonists in combination; amitriptyline and cimetidine (● solid circle), cyclobenzaprine and cimetidine (○ open circle), amitriptyline and cyclobenzaprine (▲ solid triangle), dicycloverine and cimetidine (Δ open triangle), dicycloverine and amitriptyline (■ solid square) and dicycloverine and cyclobenzaprine (□ open square). All values determined using the fluorescent calcium dye fluo-4. Results are expressed as a percentage of the 100 μM (A) and 2.5 μM (B & C) oxotremorine values (designated the maximal response) following background correction. Data points represent the mean ± SEM of the means from three separate experiments.

