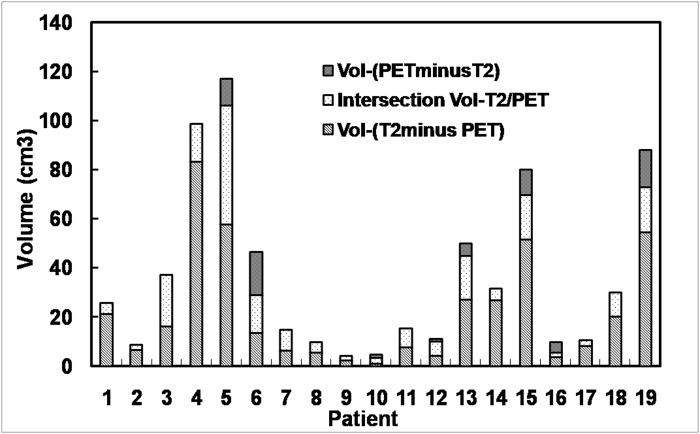
Fig 2. Comparison of tumor volumes defined by T2-weighted MRI and 18F-FLT PET.
Based on the PET/CT and MRI/CT fusion images, the tumor contours derived from PET and MRI images were superimposed together on CT images and compared. In two patients (10.5%), the regions elevated between 18F-FLT uptake in PET images and the Gd enhancement in T1-weighted MR images corresponded exactly to each other. In 14 patients (73.68%), the 18F-FLT uptake was detected beyond the scope of Gd enhancement up to 35 mm from the tumor margin in MRI (range, 2–35 mm). In 5 (26.3%) of the 19 patients, 18F-FLT uptake extended beyond 25 mm from the margin of Gd enhancement. Additionally, in 16 patients (84.2%), the Gd enhancement was located outside the 18F-FLT uptake range (Table 3 and Fig. 3).

